07 — Enterprise dashboard — 2025
Unified Device Management
One pane of glass across every device in every store.
Core purpose
To collapse the operator's view of a multi-site retail estate into a single, calm dashboard — every device class, every region, every alert in one place.
01 — The problem
Multi-site retail operations run on a sprawl of CCTV, headsets, PDAs, base stations, signage and IoT — managed from a different tool for each device class. Operators needed one view that told them what was working, what wasn't, and what to do about it.
02 — The approach
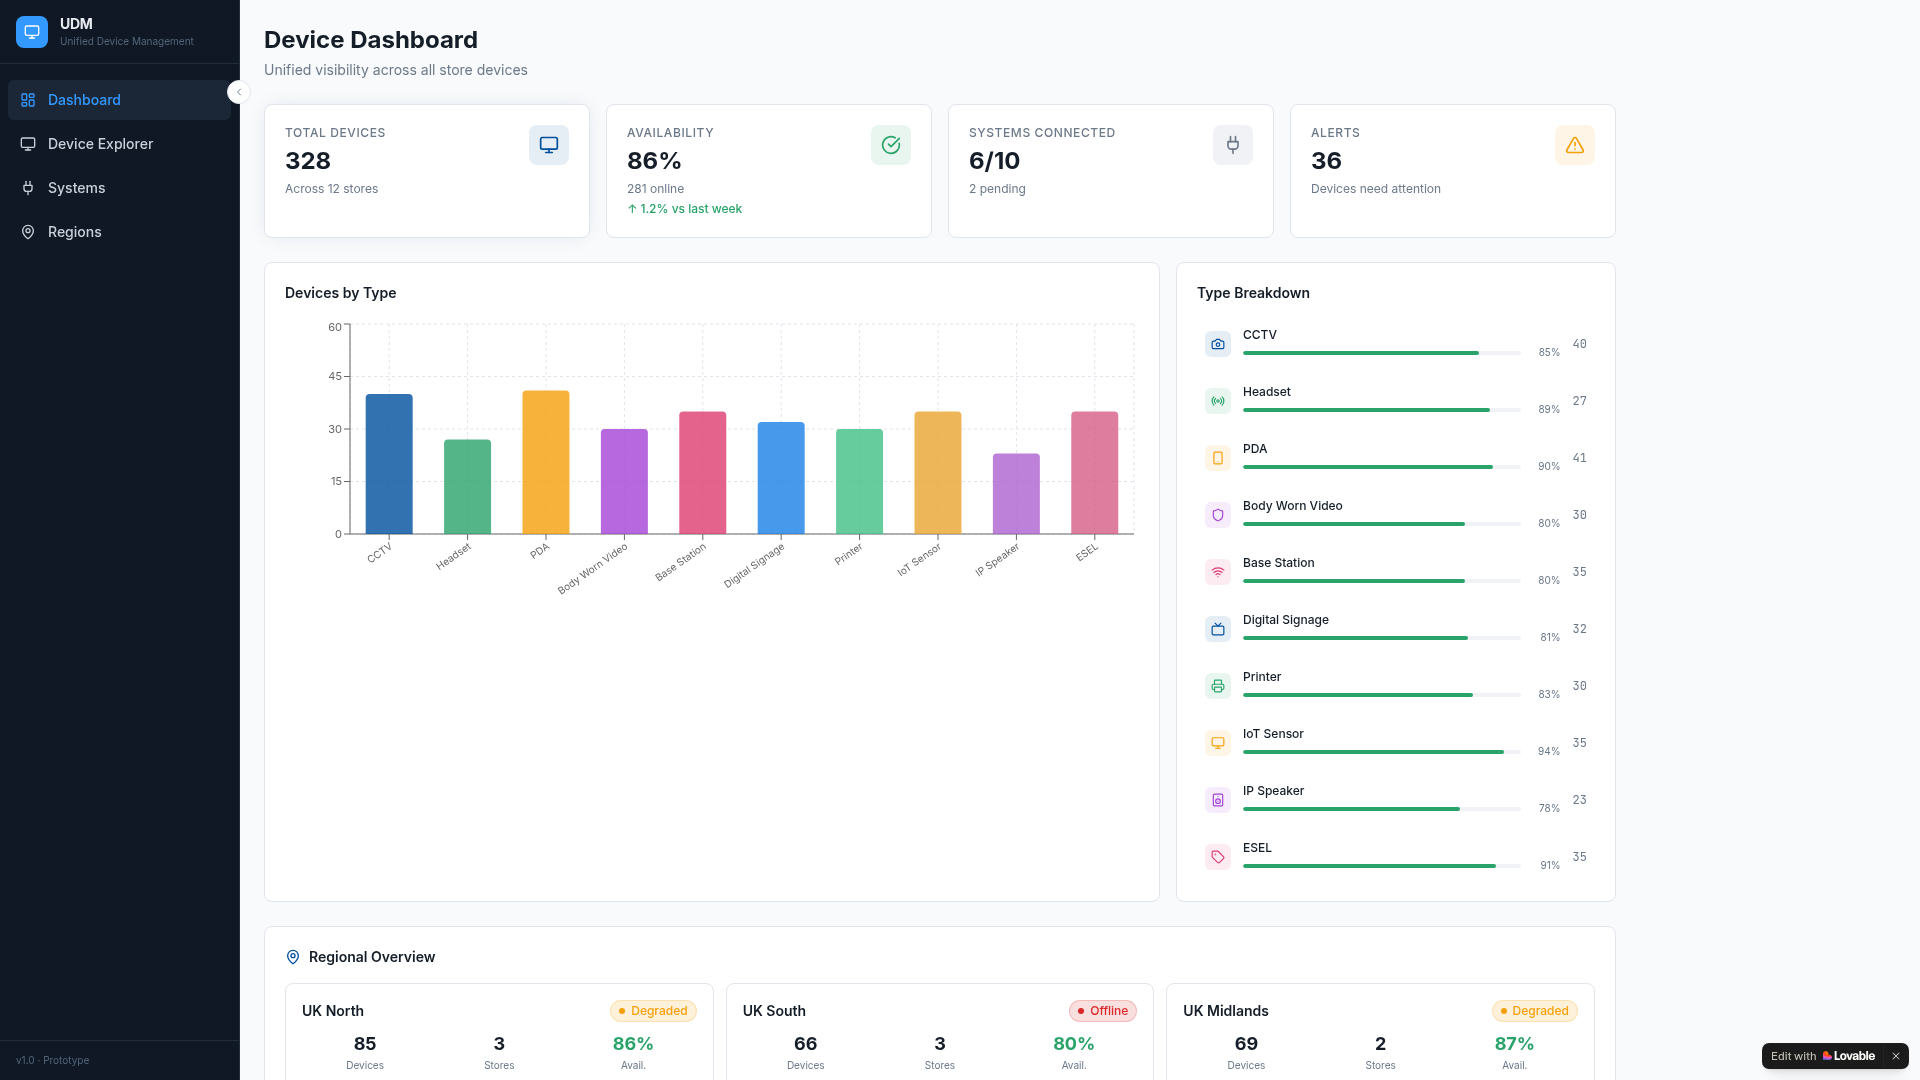
A calm operations dashboard with a clear hierarchy: estate-wide health at the top, type breakdown by device class, regional rollup at the bottom. Every number resolves to an action.
03 — The outcome
Visibility across 328 devices, 12 stores and 10 systems in a single view — designed so a duty manager can read it in five seconds.
Core features
What it actually does.
F.01
Estate-wide KPIs
Total devices, availability, systems connected and active alerts surfaced as the first thing the operator sees.
F.02
Type breakdown
Per-device-class health bars across CCTV, headsets, PDAs, body-worn video, base stations, signage and printers.
F.03
Regional overview
Rollup cards per region with status, store count and live availability — for at-a-glance estate health.
F.04
Drill-through
Every metric is a doorway to the underlying device, store or alert.
How it was built
Under the bonnet.
- Stack
- React + Tailwind, Recharts for the device-by-type plot, semantic tokens throughout.
- Information hierarchy
- Top-down: estate → type → region → device. Operators read top-left to bottom-right and that's the priority order.
- Visual language
- Quiet surfaces, restrained colour, status colour reserved for state changes only.
- Density
- Built for desk monitors but scales to a half-screen window without hiding metrics.
“One pane of glass across every device in every store.”
Visit the live site ↗Next plate — 01